






Respuesta rápida: Photometry is the measurement of light as the human eye perceives it. It translates optical output into quantities such as luminous flux in lumens, luminous intensity in candela, illuminance in lux, and luminance in candela per square metre. A useful outdoor-lighting decision needs more than one headline number: it needs the tested luminaire, its angular light distribution, site geometry, calculation assumptions, and field verification.
That distinction matters in procurement. Two luminaires can report similar watts and lumens yet place light very differently on a road, parking area, fence line, or loading yard. A photometric file can represent that distribution, but the file is not the completed design. The completed design comes from applying the correct file to the actual pole height, spacing, tilt, setbacks, surface and operating conditions.

In this guide
- What does photometry measure?
- The six quantities people most often confuse
- Photometry versus radiometry
- How a luminaire becomes photometric data
- What is inside an IES or LDT file?
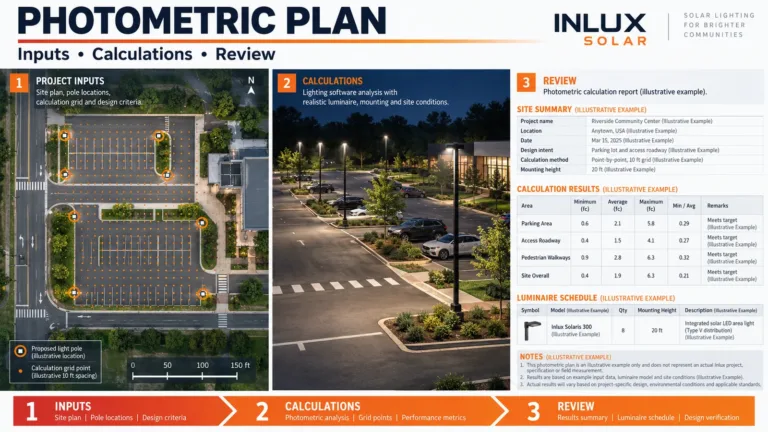
- A photometric file is not a photometric plan
- How to read a photometric report without being misled
- Field verification closes the loop
- Procurement checklist for a defensible lighting package
- Common mistakes that cost projects time
- Preguntas frecuentes
- Turn measurements into a buildable proposal
What does photometry measure?
El U.S. National Institute of Standards and Technology describes photometric quantities as optical radiation weighted by the response of the human visual system. NIST’s stated visible range is approximately 360 to 830 nanometres. Radiometry measures optical radiation as physical power; photometry applies a visual-response weighting because equal radiant power at different wavelengths does not look equally bright to people.
For a project team, the practical chain is:
- A laboratory measures the complete luminaire under controlled conditions.
- The angular intensity data is supplied in a machine-readable IES or LDT file.
- A designer places that luminaire file in a scaled site model.
- Software calculates values on defined grids and surfaces.
- The project team checks the installed result at night.
Each step can fail independently. A valid laboratory report paired with the wrong optic file produces a wrong model. A sound model paired with a different installed mounting height produces a different field result. A good average can also hide dark patches or excessive spill if nobody checks uniformity, vertical planes and sensitive boundaries.
That is why photometry should be treated as a traceable measurement chain, not as a decorative heat map added after a product has already been selected.

The six quantities people most often confuse
| Quantity | Unidad | What it answers | What it does not prove |
|---|---|---|---|
| Luminous flux | lumen (lm) | How much visible light leaves the source or luminaire in total? | Where that light lands |
| Luminous intensity | candela (cd) | How strongly is light emitted in a particular direction? | Site illuminance without distance and geometry |
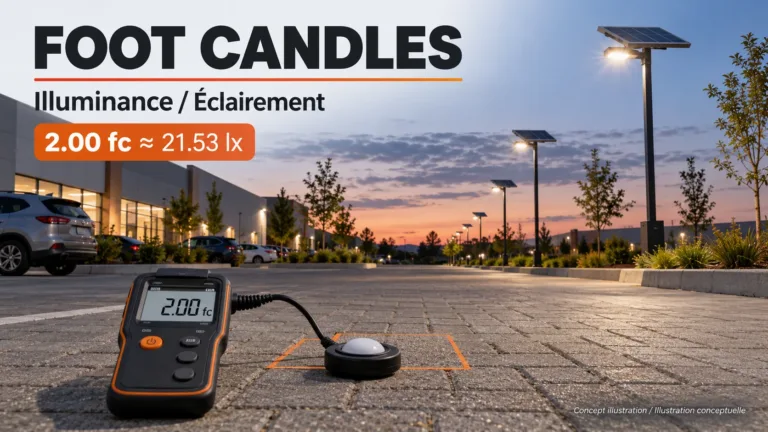
| Iluminancia | lux (lx) | How much luminous flux reaches a surface? One lux equals one lumen per square metre. | How bright the road appears to an observer |
| Luminancia | candela per square metre (cd/m²) | How bright a surface or source appears from a defined viewing direction? | Total luminaire output |
| Eficiencia luminosa | lumen per watt (lm/W) | How much measured light output is produced per unit of electrical input? | Useful distribution, glare control or solar autonomy |
| Uniformidad | ratio, stated by convention | How evenly are calculated or measured values distributed? | Compliance unless the ratio definition and grid are stated |
Correlated colour temperature (CCT), colour rendering index (CRI) and chromaticity describe colour characteristics. They may appear in the same laboratory report, but they are not substitutes for lumen, candela, lux or luminance. Wattage is electrical input, not a direct brightness measurement. Our separate lux versus lumens guide covers the two most frequently interchanged units in greater depth.

Lumens are inventory; candela is direction
A lumen value tells you the total amount of visually weighted output. Candela tells you how that output is distributed by direction. Optics, reflectors, lens geometry and shielding can concentrate or spread the same lumen inventory. That is why a road optic and a symmetric area optic should not be treated as interchangeable, even when their catalog lumen values match.
Photometry keeps those two questions separate: first quantify the output, then describe where it travels.

For example, a Type III distribution is generally intended to throw more light laterally along a roadway or perimeter than a symmetric flood pattern. The exact beam still depends on the tested luminaire, not the label alone. See our explanation of Type III light distribution before using a distribution name as a design shortcut.
Lux belongs to a point, plane and condition
A lux result has meaning only when its measurement or calculation context is visible. At minimum, record the location, plane orientation, grid height, operating mode and whether the value is initial or maintained. Horizontal illuminance on pavement is not the same as vertical illuminance at a gate camera or a pedestrian’s face. A maximum lux screenshot is not evidence of adequate minimums or uniformity.

Luminance depends on the observer and surface
Road luminance involves the light reflected from the road toward an observer. Pavement reflectance, viewing geometry and weather therefore matter. A road may meet an illuminance target yet provide a different luminance result after resurfacing, contamination or wet conditions. If a specification asks for luminance, do not replace it with lux merely because lux is easier to measure.

Photometry versus radiometry
Radiometry measures optical radiation in physical energy or power terms. Photometric measurement weights that radiation according to an agreed model of human vision. The two systems answer different questions.
| Question | Radiometric approach | Photometric approach |
|---|---|---|
| How much optical power is present? | watts or watts per square metre | Not the primary output |
| How much visible light is emitted? | Does not apply human visual weighting | lúmenes |
| How strong is output in one direction? | radiant intensity in W/sr | luminous intensity in candela |
| How much reaches a surface? | irradiance in W/m² | illuminance in lux |
| How does a surface appear from a direction? | radiance in W/(sr·m²) | luminance in cd/m² |
This is not a claim that every observer sees identically. Human vision changes with adaptation, age, spectral content and viewing conditions. The weighting functions create a common measurement framework so products and designs can be compared under defined conditions. They do not replace a site safety assessment or local lighting standard.
In procurement, photometry is therefore a common technical language—not a guarantee that one product or layout suits every site.
How a luminaire becomes photometric data
An integrating sphere can measure total luminous flux and colour-related output. A goniophotometer measures intensity at many angular positions around a luminaire. Those angular measurements describe where the luminaire sends light, including forward throw, side throw, backlight and uplight.
For an LED luminaire, photometry should be performed on the complete tested configuration because the LEDs, driver setting, thermal state and optics work as a system.
The current ANSI/IES LM-79 method covers reproducible measurements of solid-state lighting products under standard conditions, including total flux, electrical power, efficacy, intensity distribution and colour quantities. The U.S. Department of Energy’s test-method overview lists LM-79 alongside other solid-state-lighting measurement standards. A report is a controlled-condition snapshot; it does not by itself establish lifetime, installation quality or performance at every ambient temperature.
The useful purchasing question is not simply, “Do you have an LM-79 report?” Ask whether the report and data file match the exact proposed configuration:
- complete luminaire model and size;
- LED board or light-source configuration;
- driver and operating current;
- optic or lens code;
- nominal input voltage and power;
- CCT option tested;
- mounting orientation used in the test;
- report number, laboratory and test date;
- absolute or relative measurement basis;
- total flux and angular intensity distribution;
- measurement uncertainty where reported;
- file revision and the filename delivered for calculation.
If a supplier offers one generic file for several powers and optics, treat that as a design risk until the relationship is documented. Scaling one distribution to a different wattage may be reasonable only when the photometric configuration and scaling basis are verified. Changing an optic cannot be handled by multiplying every candela value by the same factor.
What is inside an IES or LDT file?
IES and EULUMDAT/LDT files are text-based formats that carry luminaire identification, geometry, lamp or source data, angle sets and luminous-intensity values. Lighting software reads those values to reconstruct the distribution. The files are small, but they are configuration-controlled engineering inputs.
Before importing one, compare its header and identifiers with the quotation and datasheet. Then view the polar curve and 3D distribution. A wildly asymmetric shape for a nominally symmetric area light, unexpected uplight, a different wattage or a different catalog number should stop the calculation until clarified.
Nuestro guide to reading an IES file explains the header, angle arrays and candela table. Keep that task separate from this page: the present guide explains the measurement system; the IES guide explains how to inspect a specific file.
Seven checks before accepting a data file
- Identity: The model, power, optic and CCT match the exact quoted luminaire.
- Source: The file can be traced to a named test report or controlled conversion.
- Orientación: The luminaire zero position and C-plane orientation are documented.
- Completeness: The vertical and horizontal angle sets cover the required distribution.
- Plausibility: Total output and peak intensity agree with the accompanying report within the stated basis.
- Revision: The file date and revision are current for the offered product.
- Simulation match: The calculation report names the same file, not a similar family model.
El CIE International Lighting Vocabulary provides standardized terms for quantities, measurements and distributions. Use the terminology in the project report. Loose phrases such as “strong brightness,” “wide coverage,” or “super high lumen” cannot be audited.
A photometric file is not a photometric plan
A data file describes one luminaire. A plan applies one or more luminaires to a site. The plan needs geometry and design criteria that do not exist inside the file:
- scaled road, parking, yard or pathway dimensions;
- pole coordinates, mounting height, outreach and setback;
- fixture orientation, tilt, rotation and quantity per pole;
- calculation surfaces and grid spacing;
- horizontal, vertical or luminance criteria;
- average, minimum, maximum and uniformity conventions;
- maintenance factor and operating mode;
- obstructions, trees, buildings and property boundaries;
- reflective surfaces or pavement class when relevant;
- sensitive receptors such as homes, habitats, water edges and driver sightlines.
This is why a product page should not promise a universal spacing. Our street-light spacing guide explains how mounting height, road width, optic and target criteria interact. For a parking site, the grid should also include entrances, pedestrian routes, perimeter spill and the vertical planes used by security cameras; see the parking lot lighting design guide.
A worked comparison without fake precision
Consider two 60 W luminaires with equal stated lumen output. Luminaire A has a narrow forward-throw roadway optic. Luminaire B has a symmetric wide-area optic. Mount both at the same height and spacing.
The equal watts do not prove equal flux because system efficacy may differ. Equal lumens still do not prove equal road results because candela by direction differs. The roadway optic may send more intensity along the carriageway and less behind the pole; the area optic may distribute more light near the pole and across a wider side angle. The resulting average, minimum, uniformity, glare and boundary spill can all change.
The correct comparison is to import the exact tested files, place each option in the same site model, keep geometry and criteria constant, and compare the same report fields. It is an A/B engineering check, not a visual judgement based on beam photographs.
Three hand checks that catch model-input errors
Software should do the complete calculation. A few manual checks can still expose a unit, ratio or configuration error before a report reaches approval.
Check 1 — efficacy arithmetic. If an illustrative luminaire report states 9,000 lm and 60 W, the reported system efficacy should be 9,000 ÷ 60 = 150 lm/W. If the datasheet says 180 lm/W, find out whether one figure is LED-package efficacy, whether the wattage changed, or whether the files belong to different revisions. This arithmetic does not prove distribution or quality; it only tests internal consistency.
Check 2 — point illuminance order of magnitude. For a point source directly facing a calculation point, the simplified normal-incidence relation is illuminance E = intensity I ÷ distance². An intensity of 800 cd at 8 m gives 800 ÷ 64 = 12.5 lx. A real road calculation also includes angle of incidence, three-dimensional distance, luminaire orientation, multiple luminaires and surface geometry. Use the 12.5 lx result as a diagnostic estimate, not as a street-light design.
Check 3 — ratio convention. If a grid reports 20 lx average and 4 lx minimum, average-to-minimum is 20 ÷ 4 = 5:1, while minimum-to-average is 4 ÷ 20 = 0.20. Both describe the same two numbers, but the notation runs in opposite directions. A specification that says only “uniformity 0.20” is incomplete unless the convention is defined.
Maintenance factors deserve the same check. In a simplified linear example, an initial 10 lx multiplied by a 0.80 maintenance factor gives 8 lx maintained. The actual factor must come from the project’s approved method, environment, cleaning plan, lumen-maintenance basis and design life; 0.80 is an arithmetic example, not a universal recommendation.
Example of a traceable input record
The following values are deliberately fictional and exist only to show record structure. They are not Inlux product data, not a project design and not recommended settings. Do not copy them into a tender.
| Record field | Illustrative entry | Cross-check |
|---|---|---|
| Drawing | P-04, Revision 2 | Latest civil issue is Revision 2 |
| Luminaria | Example-A60 | Same identifier in quote, report and schedule |
| Rated input | 60 W at 230 V | Matches tested electrical condition |
| Total flux | 9,000 lm | Matches the named test report |
| Calculated efficacy | 150 lm/W | 9,000 ÷ 60 = 150 |
| CCT option | 4,000 K | Same option in the proposed bill of materials |
| Optic code | T3-A | Not substituted by T2-B o SYM-90 |
| Data file | EX-A60-T3-A-4000K-R02.ies | Revision R02 matches the report index |
| Test record | LAB-2026-014, dated 2026-02-18 | Laboratory and report page are traceable |
| Altura del poste | 8.0 m | Measured from calculation surface to light centre |
| Outreach | 1.5 m | Matches bracket drawing BR-15 |
| Tilt and rotation | 0° tilt, 90° rotation | Orientation marker shown on the plan |
| Nominal spacing | 30.0 m | Coordinates override any rounded label |
| Ancho de la carretera | 7.0 m | Latest kerb-to-kerb dimension |
| Horizontal grid | 1.0 m × 1.0 m at 0.0 m | Origin and boundary inclusion are stated |
| Vertical gate plane | 1.5 m sensor height | Camera and pedestrian task are identified |
| Maintenance factor | 0.80 | Basis appears in the assumptions page |
| Operating scenes | 100%, 50%, 20% output | Hours and override condition are scheduled |
| Pole count | 12 poles, 12 luminaires | Schedule total matches plan symbols |
| Report issue | Revision 3, dated 2026-03-01 | Supersedes Revision 2 without mixed pages |
The point of the record is configuration control. If the calculation PDF names R01 while the submittal supplies R02, or if the pole schedule says 8.0 m while the section drawing says 10.0 m, pause approval. Recalculate from one agreed input set instead of explaining the mismatch after installation.
How to read a photometric report without being misled
Begin with the basis, not the coloured heat map. A useful report should make the following items easy to locate:
A photometry review starts by matching every report input to the current drawing, quotation and proposed operating condition.
| Report field | Review question | Failure signal |
|---|---|---|
| Project geometry | Does it match the latest drawing and dimensions? | Cropped plan or no scale |
| Luminaire schedule | Does every row identify model, optic, power and quantity? | Family name only |
| Pole schedule | Are height, outreach, tilt and orientation explicit? | “Typical pole” with no coordinates |
| Calculation grid | Is the plane, height and spacing stated? | Heat map without grid definition |
| Maintenance factor | Is the factor visible and justified? | Hidden default or initial values presented as maintained |
| Summary statistics | Are average, minimum, maximum and required ratios reported? | Average only |
| Vertical checks | Are gates, faces, façades or cameras evaluated where needed? | Horizontal grid only |
| Boundary checks | Is spill measured on the correct property plane? | No receptor or boundary line |
| Glare method | Is the required glare metric and observer geometry stated? | “Low glare” as a marketing phrase |
| Input file | Can the IES/LDT filename be matched to the offered optic? | Filename omitted |
| Controls | Does the model reflect normal, dimmed and curfew states? | One full-output scene only |
| Revision block | Is the drawing, file set and report revision controlled? | Undated PDF or screenshot |
A high average with a low minimum can produce poor uniformity. A high minimum achieved by oversizing the whole installation may create unnecessary power demand, glare or spill. The target is not the largest number; it is the required visual task with controlled distribution and a defensible operating plan.
For an off-grid system, electrical and optical decisions are coupled. A higher nightly lighting load changes battery and solar-array requirements. Review the lighting calculation together with the energy balance, autonomy assumptions and control schedule. Start from the relevant sistemas de alumbrado público solar rather than selecting wattage before the site model is built. Grid-powered projects can compare the applicable LED street light configurations while keeping the same optical review discipline.
Field verification closes the loop
Laboratory data and software predictions describe controlled inputs. Field commissioning checks what was actually installed. Schedule it after aiming, control programming and final civil works are complete, under conditions allowed by the project method.
Record at least these 15 fields:
- project, zone and drawing revision;
- date, local time and operating state;
- luminaire model, optic and power setting;
- pole identifier and measured mounting height;
- outreach, tilt, rotation and aiming;
- meter make, model, serial number and calibration status;
- measurement grid coordinates;
- sensor plane, height and orientation;
- individual readings rather than rounded summaries only;
- ambient light, moon or adjacent-source conditions where relevant;
- weather and surface condition;
- voltage or control state for grid systems;
- battery and controller state for solar systems;
- photographs tied to pole and grid identifiers;
- deviations, corrective owner and retest date.
Do not press a handheld sensor against a phone screen, point it randomly toward a lamp, or compare readings taken on different planes. Keep people from shading the sensor. If the specification requires maintained performance, an initial commissioning result should be labelled as initial and assessed with the agreed maintenance method.
Procurement checklist for a defensible lighting package
Send a supplier enough information to calculate the real task. A useful RFQ package includes:
- an editable scaled plan plus a PDF revision;
- road, path, bay, parking-space and boundary dimensions;
- pole restrictions and preferred locations;
- mounting height, outreach and foundation constraints;
- required horizontal illuminance, vertical illuminance or luminance;
- definitions for minimum, average and uniformity;
- local standard, authority or client criteria;
- operating hours, dimming schedule and override rules;
- shading, obstructions and high-risk conflict points;
- pavement or surface assumptions when luminance is required;
- environmental constraints and sensitive receptors;
- required deliverables: report PDF, IES/LDT files, schedule and revision record;
- acceptance measurement method and tolerance;
- off-grid autonomy and worst-month solar inputs where applicable.
Inlux has delivered more than 300,000 units across 60+ countries. That breadth does not create one universal target; it reinforces the need to document each authority’s criteria, site geometry and operating conditions. For parking applications, buyers can compare suitable solar parking lot light configurations only after the task and grid are defined.
Common mistakes that cost projects time
Buying watts instead of a lighting result. Electrical input affects energy demand. It does not define beam shape, minimum level or uniformity.
Using lumens as a spacing rule. Total output contains no pole height, road width, optic direction or boundary information.
Approving a heat map without the input schedule. Colours can look persuasive while hiding the wrong file, scale, maintenance factor or calculation plane.
Comparing initial and maintained values. Both can be useful, but they answer different acceptance questions. Label each clearly.
Treating every lux value as equivalent. Horizontal pavement measurements, vertical camera-plane measurements and observer-related luminance are different quantities.
Ignoring controls. A project may need separate full-output, dimmed, curfew and emergency scenes. One static calculation cannot represent all operating periods.
Accepting a family-level file. A similar housing does not prove identical LEDs, current or optics. Match the exact offered configuration.
Skipping post-installation aiming. A few degrees of tilt or rotation can change boundary spill and road distribution, especially with asymmetric optics.
Preguntas frecuentes
What is photometry in simple terms?
It is the measurement of visible light using quantities weighted to human visual response. In lighting projects, it connects laboratory measurements, IES/LDT files, site calculations and field checks.
What is the difference between photometry and a photometric plan?
The first is the measurement discipline and data behind visible-light quantities. A photometric plan applies a selected luminaire file to a scaled site, pole layout, calculation grid and defined criteria. One luminaire file can support many different plans.
Is lux the same as lumens?
No. Lumens describe total visible-light output; lux describes how much luminous flux reaches a surface area. One lux equals one lumen per square metre, but the site result also depends on distribution, distance, angle and obstructions.
Does an LM-79 report prove a street-light design will comply?
No. It provides controlled-condition measurements for a luminaire. Compliance also depends on the exact configuration, site geometry, criteria, calculation assumptions, installation and acceptance method.
Can two lights with the same wattage and lumens produce different results?
Yes. Different optics produce different candela distributions. Pole height, spacing, tilt and surface conditions then change the calculated illuminance, luminance, uniformity, glare and spill.
What should I send for a project calculation?
Send a scaled site plan, pole constraints, mounting geometry, required criteria, operating schedule, surfaces, obstructions, sensitive boundaries and the acceptance method. For solar systems, add nightly load, autonomy and worst-month solar assumptions.
Turn measurements into a buildable proposal
A credible lighting proposal should let the buyer trace the chain from the tested luminaire to the exact data file, calculation model, schedule and field acceptance check. If any link is missing, request it before comparing price.
For an Inlux review, send the site drawing and project criteria. Include the required standard, pole limits, operating hours and off-grid autonomy target. The engineering team can then return a model-specific product schedule and calculation basis instead of a generic wattage recommendation.