






The most common “mystery failure” in solar street lights is not a defective battery—it’s a weather math failure. A quote is sized using an annual-average sun number, then the rainy season arrives: SOC walks down day after day, and lights shut off early or trigger battery protection. The fix is simple: size and compare bids using worst-month Peak Sun Hours (PSH), and make the assumption verifiable in the tender.
Quick Takeaways (TL;DR)
- PSH is energy, not “sunlight hours”. 1 PSH ≈ 1 kWh/m²/day of solar irradiance.
- Always use worst-month PSH (or conservative equivalent) for sizing and bid comparison.
- Use a simple sanity check: PV Wh/day = PV_Wp × PSH_worst × η_charge, then compare against your Wh/night.
- If PV Wh/day barely covers the load in worst month, you will see SOC walk-down in cloudy weeks. Add margin or adjust dimming.
- Make bids comparable: require the supplier to declare PSH source + tilt assumption + charging efficiency, plus an energy budget sheet.
Internal hubs (use these as your tender spine): Resources Hub · Guides Hub · Project Input Sheet (Tender Pack) · RFQ/BOQ Must-Haves · Autonomy Calculator · tender evaluation checklist
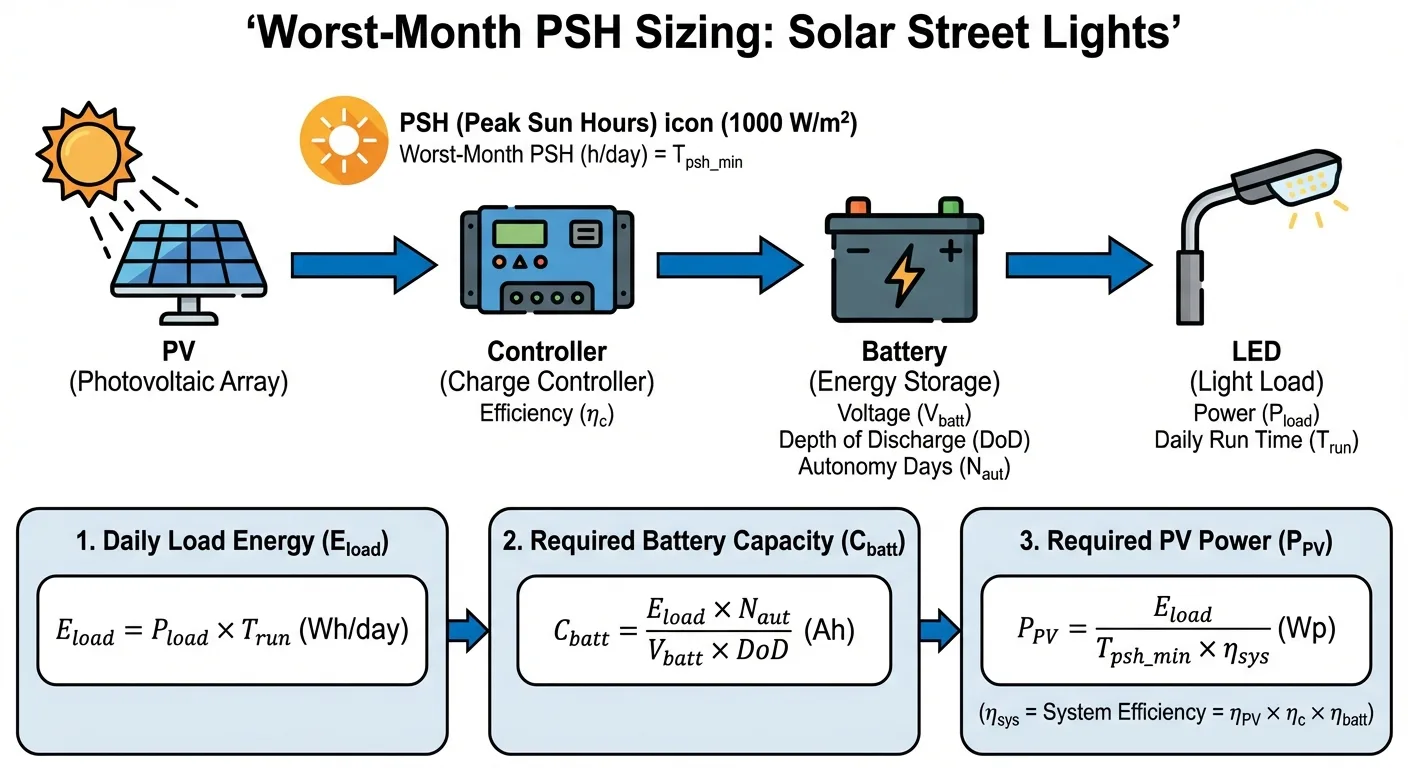
What Is Peak Sun Hours (PSH) — in one sentence
Peak Sun Hours (PSH) is a way to express daily solar energy as “equivalent hours at 1,000 W/m²”. In practice, if a location’s solar radiation is 4.2 kWh/m²/day, you can treat it as roughly 4.2 PSH for quick sizing.
If you want a reliable reference for solar radiation units (kWh/m²/day) and why solar resources vary by region, see: U.S. EIA: Solar radiation (kWh/m²/day) maps.
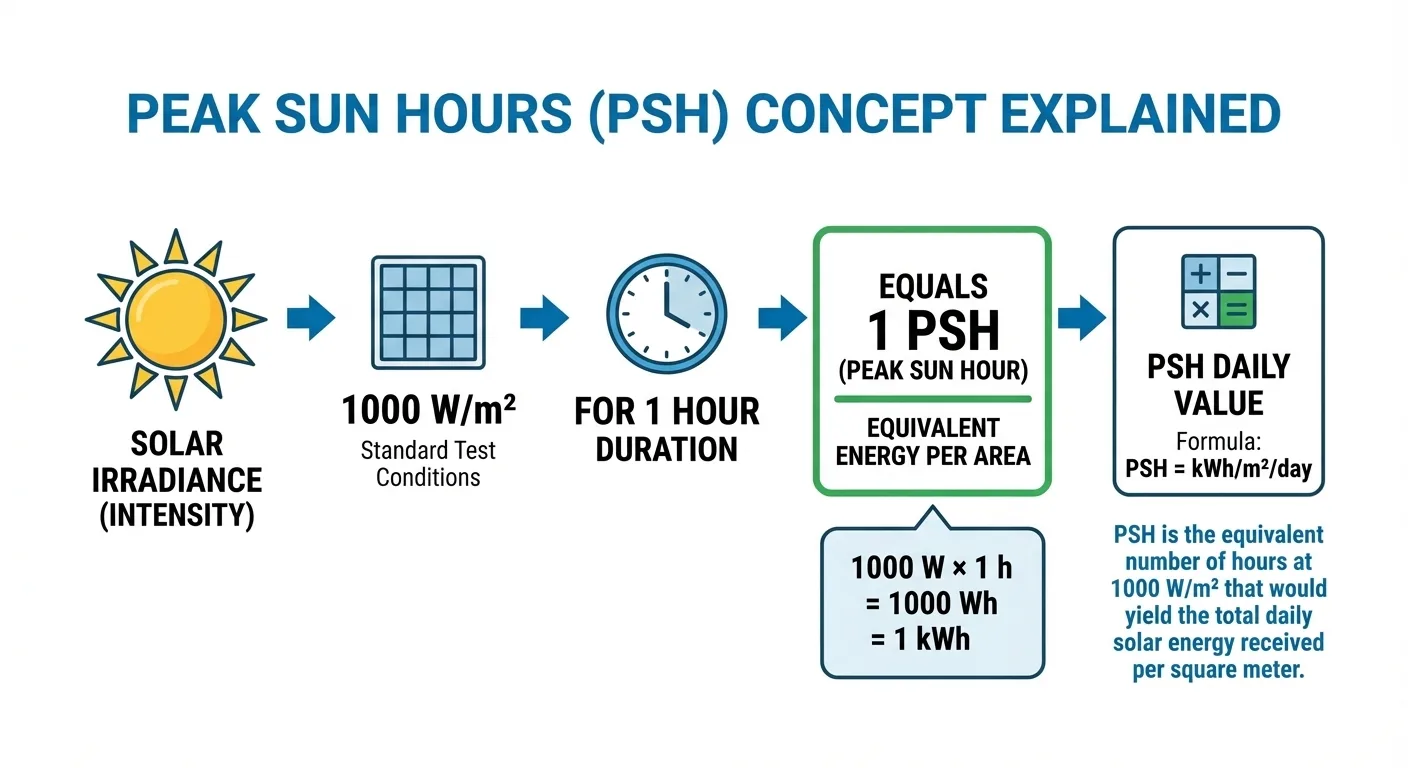
The 3 PSH numbers that cause most tender disputes
- Annual average PSH (too optimistic for reliability). Useful for marketing, not for worst-month sizing.
- Typical monthly PSH (TMY monthly averages). Better, but you must pick the worst month for sizing.
- Worst-month PSH (design PSH). This is the number that prevents rainy-season failures.
Also note the “plane” assumption: GHI (horizontal) vs tilted plane / POA. All-in-one fixtures often have a fixed panel tilt. Solar pole lights may use vertical PV, which changes the harvest profile (see: Solar Pole Lights (Vertical PV)).
How to Get Worst-Month PSH (3 practical methods)
Method A (fastest): PVWatts monthly solar radiation table
Use NREL’s PVWatts to get Monthly Solar Radiation (kWh/m²/day), then pick the lowest month as your baseline worst month. PVWatts: PVWatts Calculator (NREL).
- Enter project location (city or coordinates).
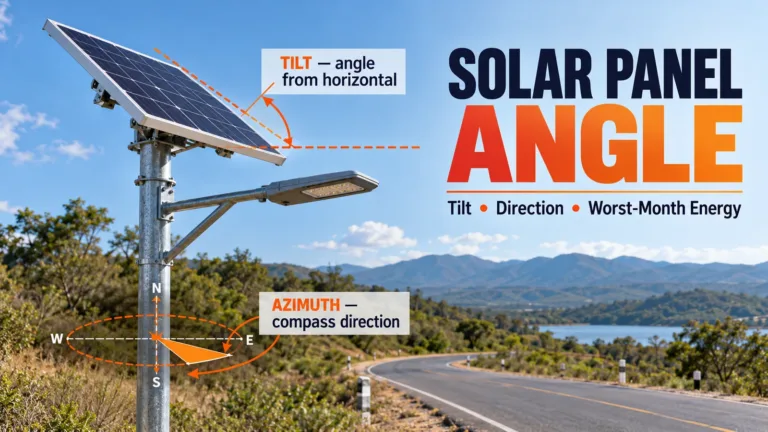
- Set tilt close to your fixture/panel tilt (or use a conservative tilt if unknown).
- Read the monthly solar radiation table and take the minimum month value as PSH_worst.
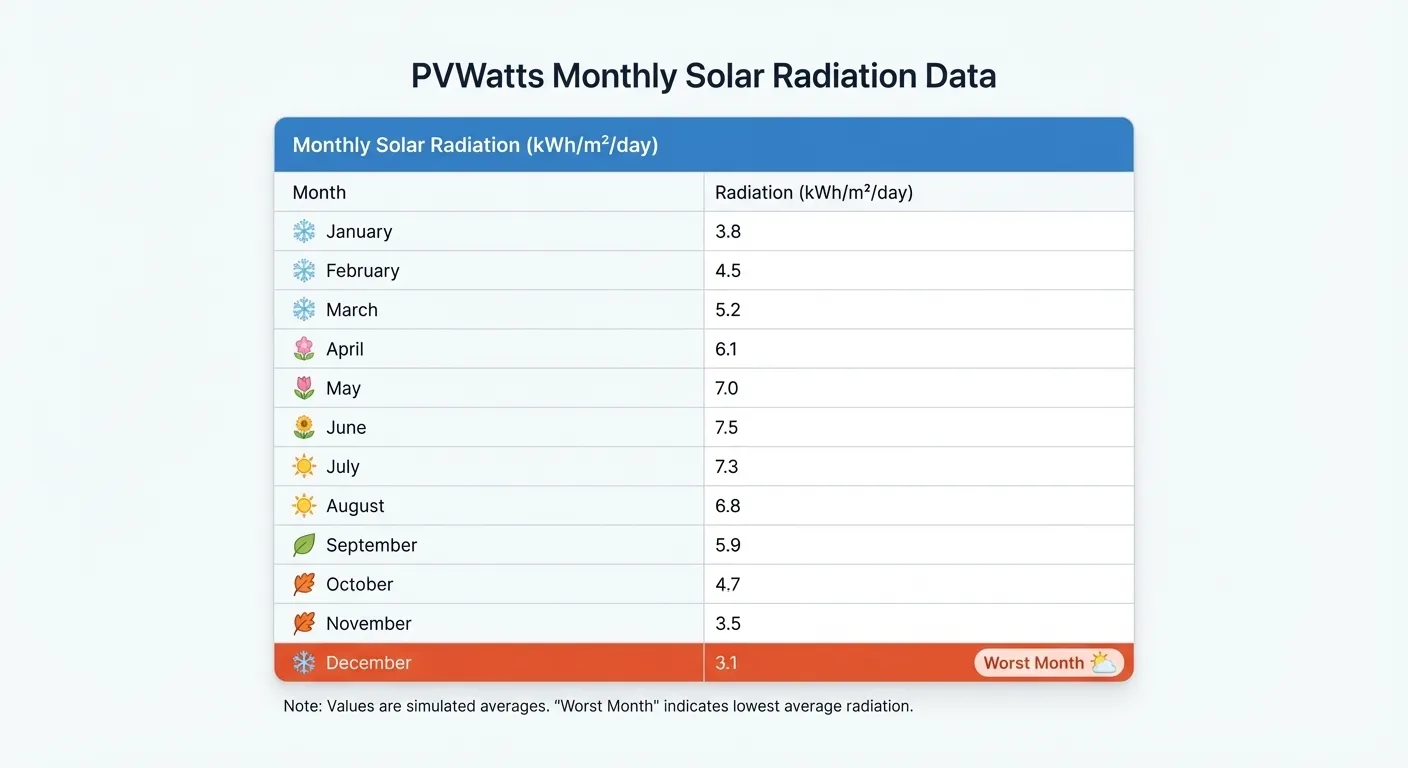
Even competitors explicitly recommend this “worst month + PVWatts” approach in spec evaluation: SolarLighting.com: interpreting spec sheets (worst-month PSH + PVWatts).
Method B (US + supported regions): NREL NSRDB Data Viewer
If you need data transparency and want to cross-check the monthly values, use: NREL NSRDB Data Viewer. It provides solar radiation datasets that many tools (including PVWatts) build upon.
Method C (global coverage): NASA POWER Data Access Viewer
For worldwide projects where you need a fast public dataset, NASA POWER can provide solar and met data: NASA POWER: Data Access Viewer. Use it as a conservative check if local ground datasets are unavailable.
Copy/Paste Calculator (Tender-Safe PSH Sizing Block)
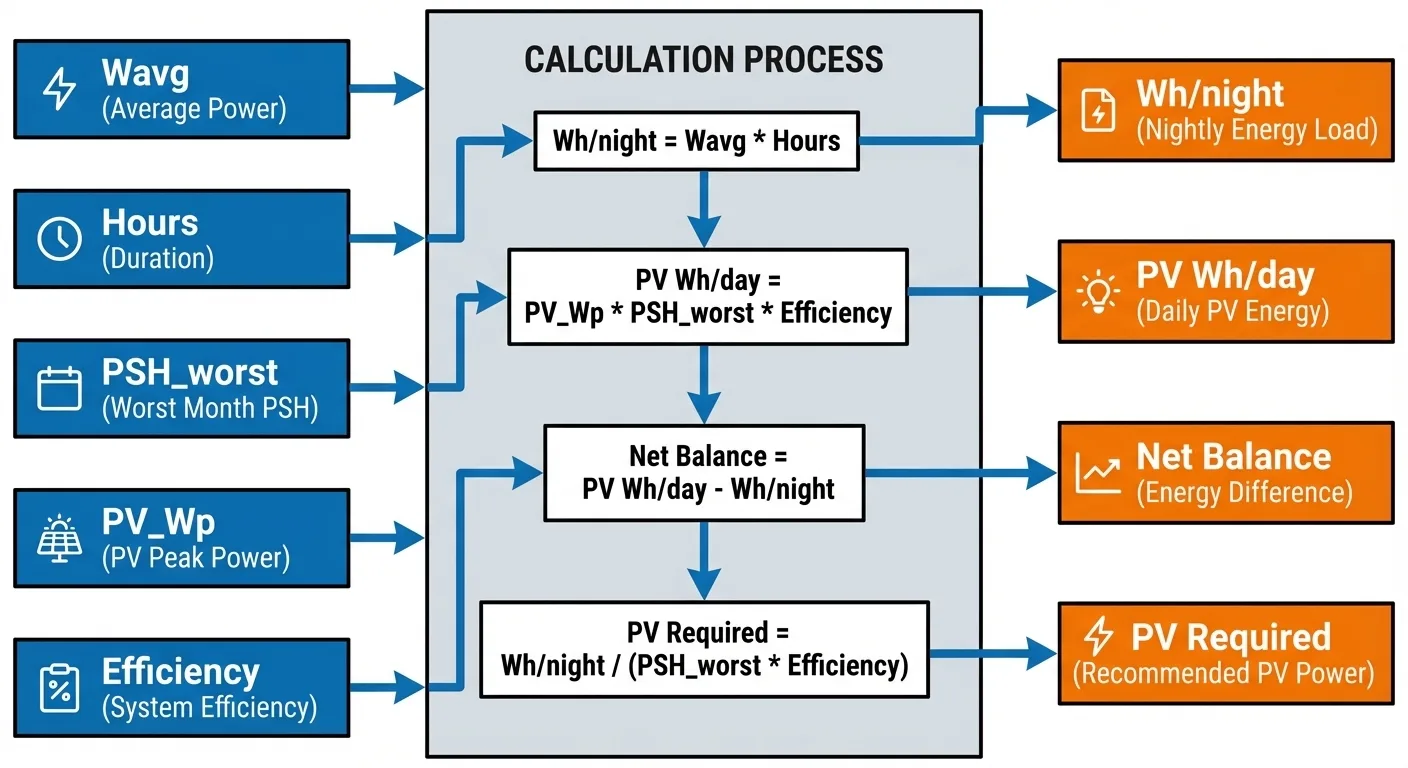
Inputs you must lock in writing
- Wavg = average LED power under the declared dimming profile (W)
- Hours/night = runtime (h)
- Wh/night = Wavg × hours
- PSH_worst = worst-month peak sun hours (h/day)
- PV_Wp = PV module rated power (Wp)
- η_charge = charging efficiency (controller + wiring + real-world losses)
The sanity check formulas
- PV daily energy (Wh/day) = PV_Wp × PSH_worst × η_charge
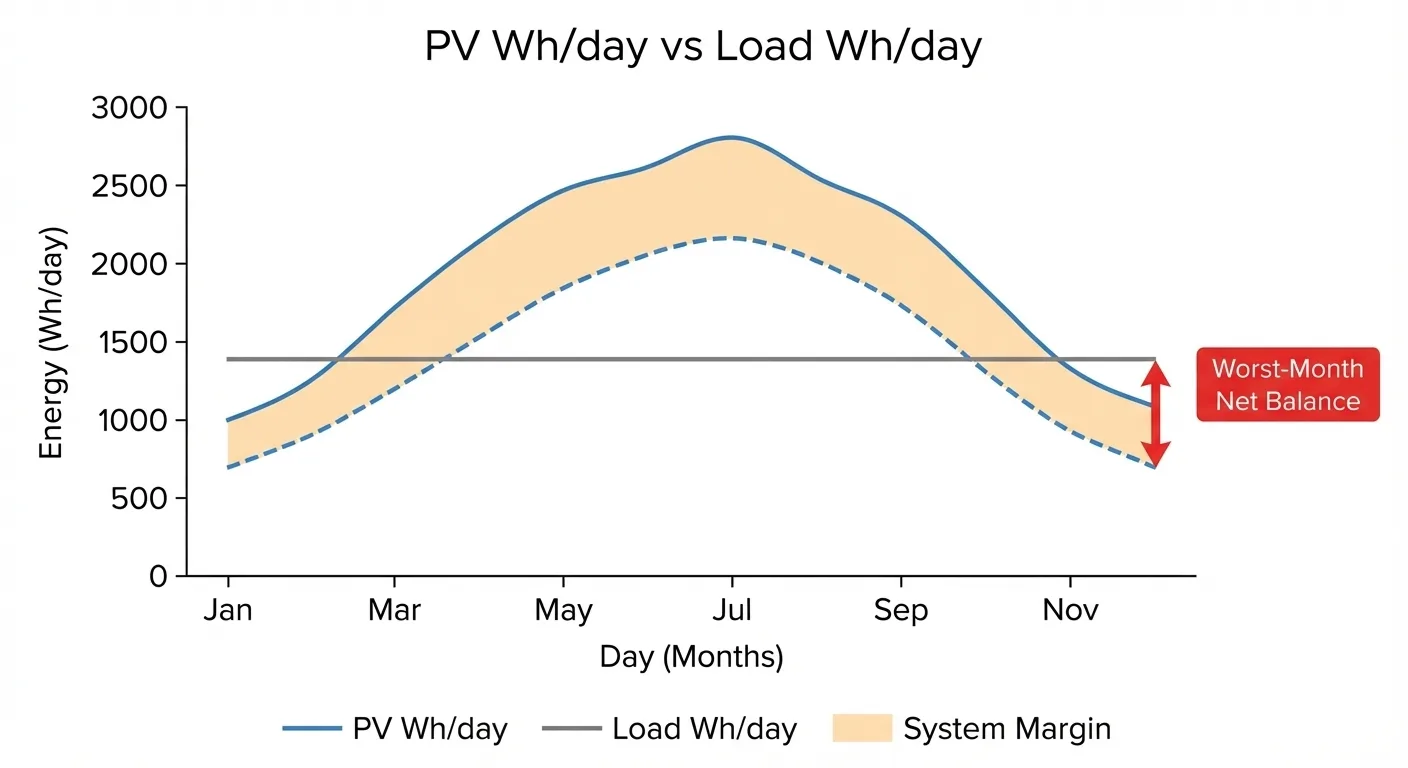
- Net daily balance (Wh/day) = PV daily energy − Wh/night
If net daily balance is near zero in the worst month, the system survives only by “burning down” battery reserve. That’s how you get early shutoff after several cloudy days. Use the Autonomy Calculator and the rainy-season guide for procurement pass/fail rules: Rainy Season Sizing (Worst-Month Method).
Worked Example (what a comparable bid looks like)
Scenario: Roadway light with dimming profile averaging Wavg = 22 W, runtime 11 h.
- Wh/night = 22 × 11 = 242 Wh
- Worst-month PSH = 3.2 h/day (from PVWatts monthly table)
- PV_Wp = 120 Wp
- η_charge = 0.78 (declared)
PV daily energy = 120 × 3.2 × 0.78 = 299 Wh/day
Net daily balance = 299 − 242 = +57 Wh/day
That positive margin is what prevents SOC walk-down. If your bid shows negative net balance in worst month, the “all-night” promise is a marketing assumption, not an engineering statement.
Worst-Month PSH Is Necessary — but Not Sufficient (consecutive cloudy days)
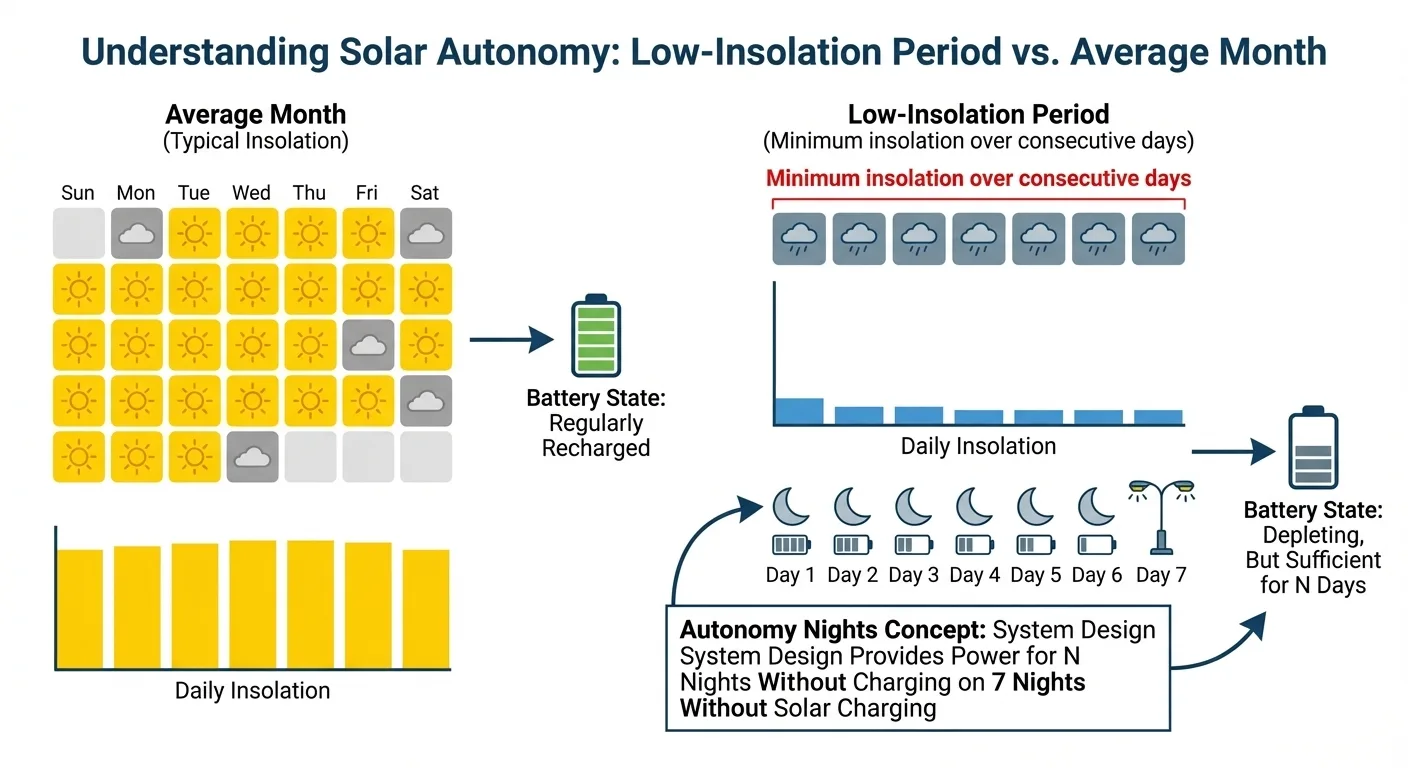
Worst-month monthly averages do not capture the real killer: multi-day low-insolation streaks. That’s why reliable designs also declare autonomy nights and a rainy-season strategy.
NASA POWER provides methodology concepts for analyzing minimum insolation over consecutive day periods. If your region has monsoon-like patterns, use a conservative autonomy assumption and require disclosure in the bid: NASA POWER methodology (minimum insolation over consecutive days).
Use these internal references to standardize the tender language: Cloudy Weather Performance (Engineering) · How Solar Street Lights Work (Sizing Example) · Solar Power System for Street Lighting (PV formula)
Copy/Paste Tender Clauses (PSH + Comparability)
Clause 1 — PSH disclosure (mandatory)
“Bidder shall declare the worst-month Peak Sun Hours (PSH) used for sizing, including: (a) data source (PVWatts / NSRDB / NASA POWER or equivalent), (b) plane assumption (horizontal GHI vs tilted/POA), (c) the numeric PSH value and the selected worst month.”
Clause 2 — Energy budget sheet (mandatory)
“Bidder shall submit an energy budget sheet including dimming profile, Wavg, runtime hours, Wh/night, PV_Wp, η_charge assumption, and a worst-month net daily balance check.” (Use: RFQ/BOQ Must-Haves.)
Clause 3 — Bid comparability rule
“Bids missing worst-month PSH disclosure and energy budget sheet shall be labeled Not Comparable / High Risk before any price comparison.”
Commissioning Reality Check (so PSH assumptions hold on site)
- Confirm PV orientation and shading (growth, new structures, seasonal shadow).
- Record dimming profile settings and keep a commissioning folder.
- Plan cleaning/inspection cadence (soiling can “steal” PSH in practice).
Internal references: Installation & Commissioning Checklist · Maintenance Plan · Direct Sunlight & Shade Reality
FAQ (Tender & Engineering)
Is PSH the same as “hours of daylight”?
No. PSH is an energy measure (equivalent hours at 1,000 W/m²), not the number of daylight hours.
Why use worst-month PSH?
Because projects fail in the worst month. Annual averages hide rainy-season deficits.
Where can I get PSH quickly?
Use PVWatts monthly solar radiation table: PVWatts (NREL).
What dataset can I use to cross-check PSH?
NREL NSRDB Data Viewer (coverage depends on region).
What if my project is outside NSRDB coverage?
Use NASA POWER as a conservative check: NASA POWER DAV.
What’s the minimum sizing math I should demand?
PV Wh/day = PV_Wp × PSH_worst × η_charge; compare to Wh/night. Require the supplier to disclose every input.
What is η_charge?
Charging efficiency capturing controller, wiring, real-world losses. It must be declared, not assumed silently.
Why do lights shut off early after a cloudy week?
SOC walk-down: the system’s net daily balance is negative in worst-month conditions.
Can autonomy days alone solve it?
No. Autonomy helps during no-charge periods, but the system must also recharge reliably afterward.
How do I set autonomy nights?
Use your risk profile (rainy season, critical roads). Start with: Autonomy Calculator.
Does tilt matter for PSH?
Yes. Tilt changes the captured irradiance. All-in-one fixed tilt differs from vertical PV pole lights.
What’s the fastest tender deliverable to prevent disputes?
The energy budget sheet + worst-month PSH disclosure + net balance check (pass/fail gate).
Should I require photometrics for roadway projects too?
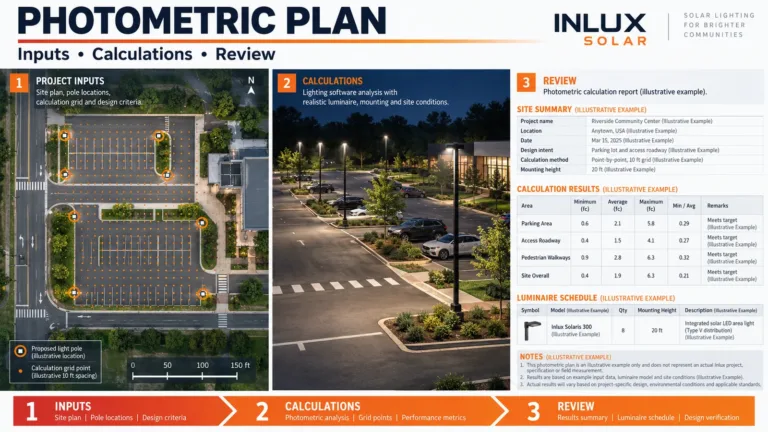
Yes. If spacing/uniformity is claimed, require IES + layout report: IES & DIALux Center.
What’s the biggest commissioning mistake that breaks PSH assumptions?
Unrecorded dimming changes, shading growth, and PV soiling. Fix with evidence-based commissioning.
Can I compare two bids if they use different PSH sources?
Only if both disclose source + tilt plane + worst-month value. Otherwise, it’s apples-to-oranges.
What if a supplier refuses to disclose PSH assumptions?
Label the bid “Not Comparable / High Risk” before any price discussion.